ChatMTB is an AI assistant — AI can make mistakes, always verify info

The State of the Nation 2025: iBikeRide UK MTB Trail Report summarises what riders wrote in iBikeRide reviews during the 2025 Trail of the Year campaign period, based on insight from 984 reviews across 92 trails. It is written for trail operators, trail associations, land managers, and riders.
Like this?
Executive summary
This report summarises what riders wrote in iBikeRide reviews during the 2025 Trail of the Year campaign.
At a glance (theme mentions in review text)
What riders value most: Variety of trails (228), Maintenance and build quality (218), Community and vibe (185), Progression and coaching (176), Jumps and airtime (151).
Where riders ask for improvements: Cafe shop and food (170), Toilets and facilities (116), Access parking and signal (97), Blue entry-level options (79), More tech or variety (45).
These are directional counts of what riders chose to mention most often in review text.
Five headline insights from the 2025 export
- Riders consistently reward places that feel looked after and offer real choice across a visit. In the headline theme counts, Variety and Maintenance are the most frequently mentioned positives.
- General Setup is where scores vary most and where riders most often add improvement notes, even in otherwise high-scoring reviews. In this report, General Setup means the basics around the riding: parking and arrival, signage and wayfinding, toilets, food and drink, shelter, and how easy it is to run a day on site.
- The rider day is the report’s practical lens: Plan, Arrive, Warm up, Ride, Recover, Leave. It shows where a riding day is most likely to be won or lost. Early in the day, reviews often turn on expectation setting, parking, and first-visit clarity, because those decide whether riders get straight into the trails or start the day frustrated. Later, reviews often turn on the basics that support a full session: toilets, food, shelter, and how well the venue handles busy periods. The practical takeaway is that small, well-timed improvements at these points can lift the whole day even when the riding is already strong. In other words, many of the most common improvement notes sit around the riding, not only in the riding itself.
- Lower-rated reviews tend to focus more on condition and disruption. Riders more often mention maintenance issues, closures, rough or unpredictable sections, and situations that feel harder to manage on a busy day. Higher-rated reviews more often explain what “worked” across the whole visit, for example a good mix of trails, features that reward repeat laps, clear progression from easier to harder riding, trails that feel looked after, and a smooth day around the riding (parking, signage, food, and toilets).
- Venue model changes what riders focus on. At uplift bike parks and session venues, riders often describe the whole day package: time actually spent riding, uplift reliability, value for money, queues, and the on-site basics. At trail centres, riders more often focus on ease of navigation, predictable trail condition, and progression for mixed-ability groups. In local trail networks and multi-use woods, riders often praise natural trail character, technical riding, but criticism tends to centre on wayfinding and shared-use pinch points.
What riders praise most
- Variety and trail character that create multiple “ways to have a good day”.
- Progression that is designed in: stepping stones, warm-up options, practice areas, and a clearer “middle”.
- Trails that feel actively maintained and predictable to ride.
- A venue feeling welcoming and well run: community and vibe.
What riders most often want improved
- General Setup basics: toilets, food and drink, shelter, water, and clear on-site information.
- Access and arrival: parking pressure, signage, and first-visit clarity.
- More entry-level options and a clearer progression ladder.
- Maintenance cadence where core trails have become rough, washed out, or inconsistent.
- A smaller but clear signal from some riders asking for more advanced technical options (for example “more black trails” or “more DH”), though it appears less often in the 2025 export than requests for entry-level/progression and day-out basics.
What this means for 2026 planning
- Protect the core riding product with predictable maintenance on the main trails riders rely on.
- Build progression as infrastructure: warm-up options, stepping stones, and a clearer “middle” (the progressive layer between beginner and advanced riding, where riders can practise and build confidence before committing to bigger features or harder grades).
- Treat General Setup as a multiplier: small improvements to basics can lift how the whole day feels.
- Design for busy-day reality: queues, capacity pinch points, toilets, and simple on-site clarity.
Contents
- What riders like and want improved by the five dimensions
- Mapping the riders day
- Trail types: what changes between bike parks, trail centres, and trail networks
- Charts and comparisons
- Appendix
What riders like and want improved by the five dimensions
This section keeps the focus on the five scoring dimensions riders rate (Grin Factor, Trail Variety, Skills Development, Trail Quality and General Setup). The overall scoring is right-shifted (median overall rating 4.9), so this section looks at where each dimension is consistently strong, and where it is more variable or prone to “a good day, but” friction occurs.
Grin Factor
Signal from the data: Mean 4.68. 78% of reviews score this 5.0. Only 6% score it 3.0 or below. This is the dimension that most closely tracks the overall rating (correlation with overall score: 0.89).
What riders like: Grin Factor stays high when the riding feels “easy to enjoy” across a whole session. In the text, this is usually described as fun flow, features that reward repeat laps, and a day that feels smooth rather than interrupted.
What could be improved: When Grin Factor drops, it is usually not because riders hated the place. It is more often because something got in the way of fun: trails riding poorly for the conditions, the experience feeling stop-start, or expectations not matching what is on the ground.
Trail Variety
Signal from the data: Mean 4.51. 67% score 5.0. 9% score 3.0 or below. This is one of the two most “gap-revealing” dimensions in the dataset, because riders are quick to notice what is missing.
What riders like: Variety reads as breadth and choice across a visit. Riders consistently reward venues that offer multiple “ways to have a good day”, for example different styles of line, different intensities, and options that still ride well when conditions change.
What could be improved: Lower Variety scores tend to come from a missing layer in the mix. That is often a missing entry-level option, a missing technical option, or a network that feels one-note once you have done the main loop or key line. Riders also flag when the variety is there on paper, but the ride does not feel diverse due to maintenance or closures.
Skills Development
Signal from the data: Mean 4.57. 71% score 5.0. 8% score 3.0 or below. This dimension closely tracks overall satisfaction (correlation with overall score: 0.87).
What riders like: Skills scores stay highest where progression is designed in, not bolted on. In review text this usually shows up as clear stepping stones, the chance to repeat features safely, and lines that help riders build confidence rather than forcing an all-or-nothing jump in difficulty.
What could be improved: When Skills scores dip, it is usually because progression feels uneven. Venues can be strong at entry-level or strong at advanced riding, but riders describe a thinner “middle” where they can practise, warm up, and take a clear next step. Requests commonly include practice zones, clearer stepping stones between grades, and a more obvious progression ladder that works across repeat visits.
Trail Quality
Signal from the data: Mean 4.60. 72% score 5.0. 7% score 3.0 or below. Quality is generally strong across the export, but when it falls it tends to fall sharply.
What riders like: High Quality scores are associated with trails that feel “looked after”. Riders notice shaping, predictable surfaces, drainage, and whether the venue feels actively maintained rather than left to fade.
What could be improved: Quality criticism is usually specific and practical. It often relates to wear and tear that changes how a trail rides (blown-out sections, overgrowth, rough braking zones, or surfaces that feel unpredictable). Riders also link Quality to confidence: when the trail feels consistent, they ride better and enjoy the day more.
General Setup
Signal from the data: Mean 4.40 (the lowest of the five). 62% score 5.0. 13% score 3.0 or below (the highest “low-score” share). This is also the most variable dimension (highest spread in scores).
What riders like: General Setup earns strong scores when the day feels easy to run. Riders notice clear arrival and parking, decent wayfinding, a functional trailhead, and the basics that keep a riding day comfortable (food, shelter, toilets, and a sensible flow on busy days).
What could be improved: General Setup is where many otherwise positive reviews still include improvement notes. The recurring friction points are basics that compound on a busy day: toilets, food and drink options, shelter in poor weather, and practical access issues like parking pressure, weak signal, or unclear on-site information. These issues rarely define the riding, but they often define how hard the day felt.
Operator read-across: In this 2025 export, the riding dimensions (Grin, Skills, Quality, Variety) are generally high and tightly clustered. General Setup is the most “make or break the day” variable, and it is also where riders most often add improvement notes even when their overall rating is strong.
Mapping the Riding Day
This section of the report follows the typical flow of a riding day (plan, arrive, warm up, ride, recover and leave) to identify where operators do it well and where friction affects each section of the riders day. It uses direct quotes from rider reviews to bring the experience to life with first a positive and then a negative quote.
Plan
Planning shows up as expectation setting. Riders often frame value in terms of travel time, cost, and whether the venue matches what they think they are turning up to ride. Where expectations do not match reality, ratings drop quickly even when the setting itself is good.
Love it here. Only been 3 times but I think it’s fantastic. It’s well worth a visit.
Sadly the park is slowly being reduced to a series of walking trails. A nice day out, not really a trail centre.
What this means for operators and land managers: riders are signalling that clear expectation-setting matters. When people arrive expecting a trail centre or bike park experience and get a different format of riding, the review language shifts from “what is here” to “what I expected”.
Arrive
Arrival friction is most visible in parking, signage, and first-visit navigation. When riders feel delayed or uncertain about where to start, it often becomes part of how they judge the rest of the day.
Got it all. Trail centre trails are awesome. Off piste is awesome. Car Park is cheap and big enough, never struggled for parking
Disappointing visit. Poor signage, and parking is extortionate.
What this means for operators and land managers: riders repeatedly treat navigation and parking as part of the riding product, not as separate “admin”. Where arrival is easy and predictable, riders tend to talk about trails. Where arrival is not, riders keep talking about access.
Warm up
Progression is one of the strongest positives in 2025, but riders describe it in practical terms: skills areas, coaching, practice zones, and stepping stones between grades. Where the middle ground feels missing, riders call it out even in otherwise positive reviews.
Love it perfect for developing your skills. staff and coaches super friendly
There’s beginner tracks, and hard tracks. There’s not really any amateur trails or progressive trails
You will note often riders still give a high score while still noting specific improvements, so these quotes are treated as ‘friction signals’ rather than evidence a venue is poor.
What this means for operators and land managers: riders are not only asking for harder lines. They are also describing the “join-up” between levels. When progression feels stepped and supported, it is praised. When there is a gap, it becomes an improvement request.
Ride
Once riding starts, the strongest positive language clusters around variety and trail character. Riders describe a mix of trail styles and feature types. Where venues feel one-note, riders mention boredom, repetition, or a lack of challenge.
Very diverse trails lots of tech and flow
Not alot very boring with nothing too challenging
What this means for operators and land managers: “variety” is not just a nice-to-have in rider language. It is repeatedly linked to day satisfaction and repeat-visit intent, especially when paired with a clear progression pathway.
Ride: safety and expectation management
Safety rarely appears as a policy topic. It appears when riders notice risk, crowded conditions, or changes that do not feel bedded in yet. It also appears when operational realities shape behaviour, for example, uplift waiting, feature closures, or busy-day pressure.
Great little park not overcrowded. And you don't have to wait for the uplift
Needs a bit of work. Those new trails are dangerous
What this means for operators and land managers: riders often notice safety indirectly, through flow, crowding, and whether changes feel ready. Where risk feels unexpected, it becomes memorable review text even when the overall venue score stays high.
Recover
Facilities show up as friction reducers. Toilets, food, shelter, and water are often mentioned when they are missing, overwhelmed on busy days, or unusually good. In many reviews, facilities are not the reason a place is loved, but they are a common reason a day feels harder than it needed to be.
Great set up, amazing trails. Cafe is first rate
Not worth the time getting there. Parking is expensive and got a ticket too
What this means for operators and land managers: when riders repeatedly ask for toilets and basic amenities, it is often tied to busy-day capacity. The same trail experience can be described very differently depending on whether the day feels supported off the bike.
Leave
This is where maintenance and feature availability show up most strongly. Riders describe surface condition, drainage, overgrowth, and whether key lines are open. Where venues feel actively cared for, the tone tends to shift toward confidence and repeat visits. Where maintenance feels behind, riders call it out directly.
Really well maintained by a group of passionate volunteers. With something to suit all styles of riding.
Never finish new trails, don't maintain certain trails properly
What this means for operators and land managers: riders use maintenance language as a proxy for trust. Where trails feel looked after, riders talk about returning. Where trails feel left, riders talk about it as a pattern, not a one-off. Leave is where the gap between a great riding day and a frustrating day shows up most clearly. Some reviews are overwhelmingly positive, while a small number are strongly negative.
Trail types: what changes by venue model
This section groups common patterns riders describe, using examples from across the dataset. It is not a ranking. It is a way of making the feedback easier to act on depending on what you run.
Uplift bike parks and session venues
Riders often describe these venues as a full-day product, where trails, uplift reliability, queues, and facilities blend together. When the operational side runs smoothly, riders focus on variety, progression, and the riding itself. When it does not, queues and amenities quickly dominate review text.
Varied trails. No waiting around. Great cafe
The uplift , it is very slow, and the queues are. Only managed to get 8 runs in also the toilets could be better
Operator and land manager takeaway: riders tend to judge value through throughput. When queues build and basics are stretched, the day can be described as “less riding than expected”, even when the trails themselves score well.
Trail centres
Trail centres attract a wide mix of riders and days out, including first-timers and families. Riders repeatedly comment on how easy it is to navigate the network, whether trails feel maintained and predictable, and whether the venue supports progression across ability levels. There is also a smaller but consistent signal from some riders asking for more advanced technical options (for example “more black trails” or “more DH”), but it appears less often in the 2025 export than requests for entry-level progression and the practical day-out essentials (parking, signage, toilets, and food). The common thread is reliability: whether a rider can arrive, find the right trails, and have a good day without local knowledge.
Very well maintained trails and easy to access them
Plenty of off piste to go at while the marked out trails need maintenance there all washed out
Operator and land manager takeaway: Trail centres are judged on day-out reliability. Clear waymarking and predictable trail condition reduce confusion and help riders choose trails that match their ability. When maintenance slips on the core marked trails, riders notice quickly because it affects confidence, flow, and whether they would recommend the venue to newer riders. Progression also needs to be built in over time: riders respond well when there is a clear ladder from entry-level to harder options, with warm-up or skills areas and obvious “next step” trails that let people develop across repeat visits rather than hitting a gap. General Setup friction (parking, toilets, and the trail hub or trailhead) often appears in otherwise positive reviews, because trail centres are often used as all-day venues rather than quick local laps.
Local trail networks and multi-use woods
These venues are often lighter on facilities and formal trail hubs, so riders focus on trail character and the feel of natural riding. Where it works, reviews lean into variety, views, and the satisfaction of more natural, technical sections. The main negatives tend to be practical rather than aesthetic: navigation clarity and shared-use pinch points.
Good variety of natural trails, nice views and some really challenging sections if you’re in the mood!
Signage for walkers crossing with cyclists! Some DH sections run straight into walkers which is dangerous!! More seperation for families and skilled riders.
Operator and land manager takeaway: Riders value these places for natural trail character, variety, and a sense of discovery. The operational job is to protect that experience with light-touch basics where they matter most, clear wayfinding at key decision points, and visible shared-use management at high-speed crossings. When those pinch points are unmanaged, they can dominate feedback even when the riding is strong.
Charts: What changes between top and bottom rated venues
This chart compares theme mention rates in review text between the top slice (top 5 venues) and the bottom slice (bottom 5 venues) in the 2025 export. A “mention” is keyword-based, so it shows what riders chose to talk about, not whether the mention was positive or negative.
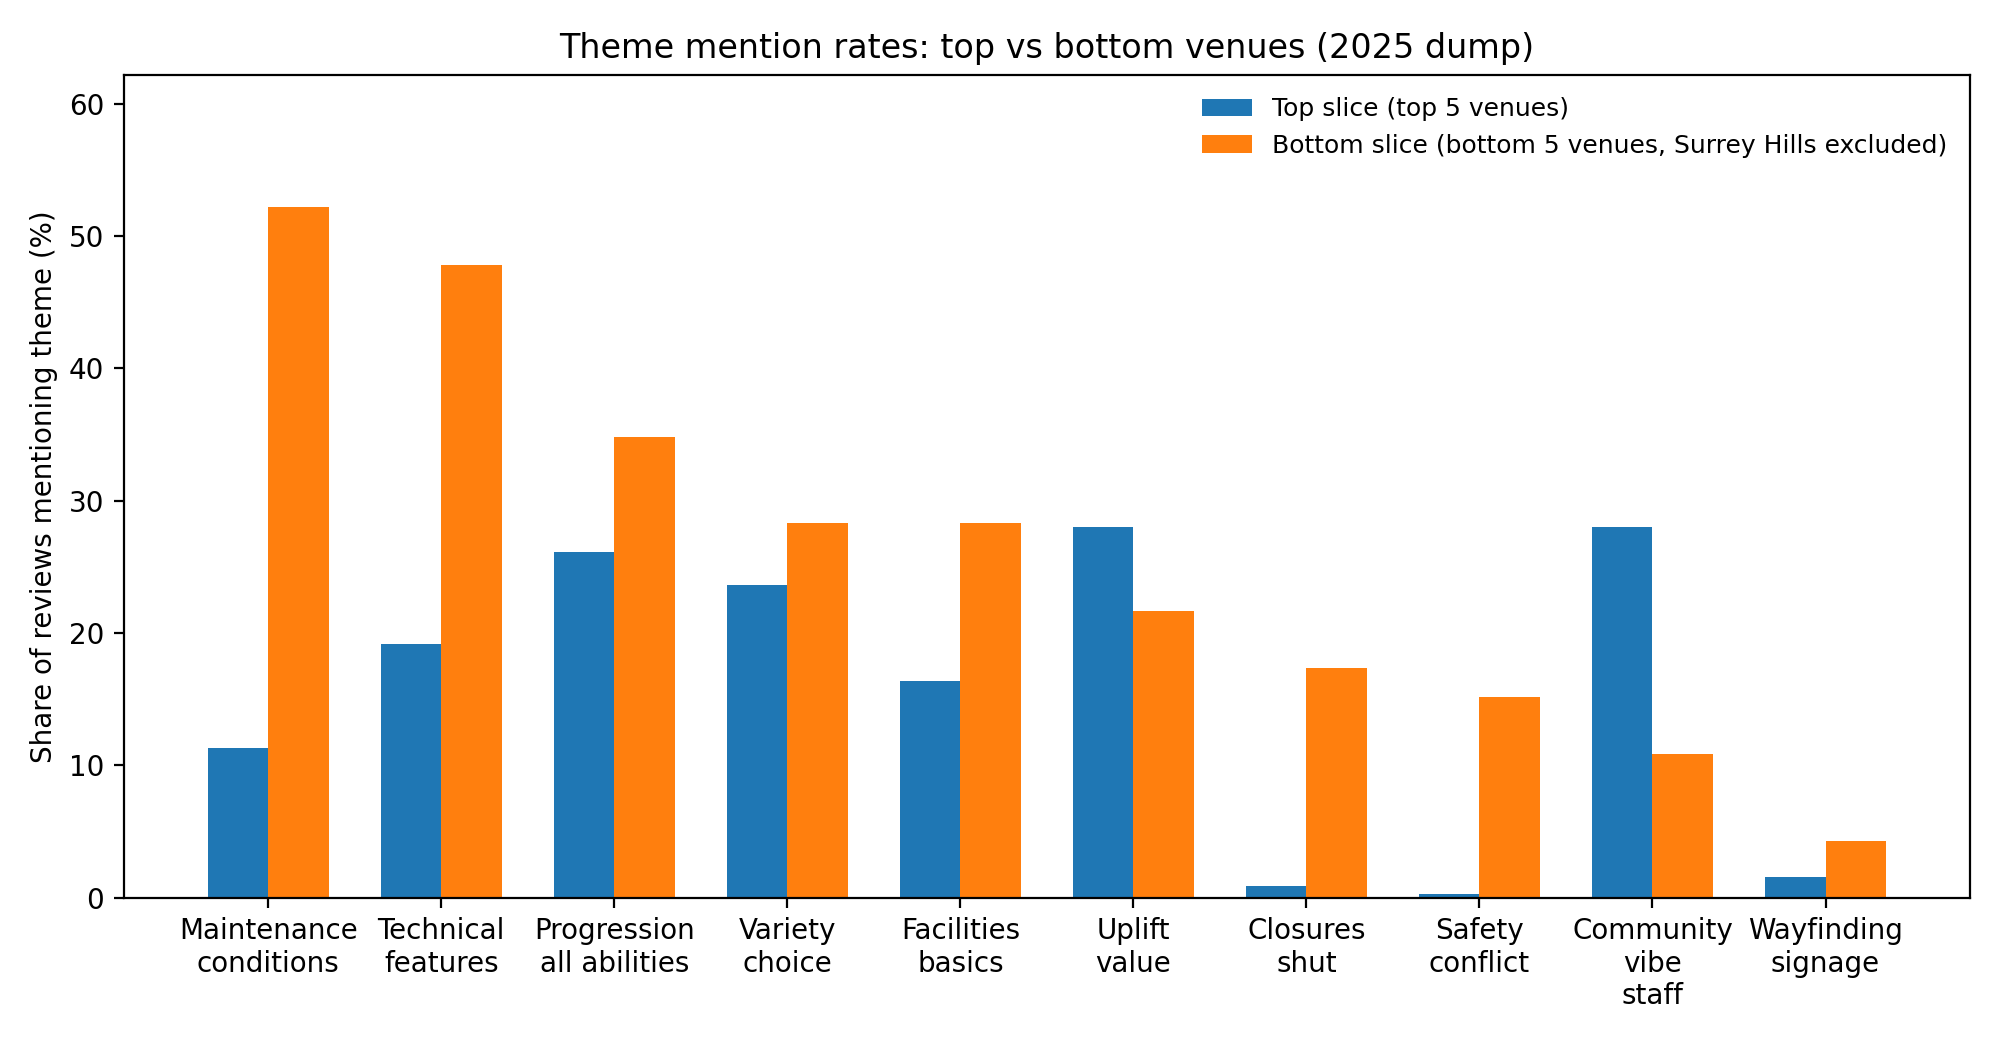
What this suggests in 2025:
- Bottom-rated venues are dominated by operational and trust topics. Maintenance and conditions is the strongest separator, and closures/shut and safety/conflict appear far more often in low-rated review text.
- General Setup (parking, access, signage, facilities, and overall on-site experience) is also mentioned much more often in the bottom slice, which suggests these basics become more visible when the day feels harder than expected.
- Top-rated venues are more likely to be described through “why it was worth it” themes. Community/vibe/staff and uplift/value are both stronger in the top slice.
- Progression and variety appear in both slices. They are not only “good venue” themes, they are also themes riders raise when they feel something is missing or uneven.
- Wayfinding/signage is a smaller signal overall. It rises slightly in the bottom slice, but it is not a primary driver compared with maintenance, closures, and safety/conflict.
Why this matters: the chart acts as a quick “difference view”. It highlights which themes riders are most likely to raise when satisfaction drops, and which themes show up more often when riders describe a complete, well-run day.
Country comparisons
The two charts below show country-level signals from the 2025 review export. They are useful as a high-level snapshot, but they should be read with the dataset context in mind. Review volumes differ by country, and a small number of high-volume venues can influence the averages and percentages.
How to read these charts:
- Mean rating by country shows the average score given in reviews from each country.
- 5-star share by country shows how often reviews hit a perfect 5.0 score, which is a simple “how often did everything click” signal.
- Small samples: where review counts are low, the result can move significantly with a handful of reviews.
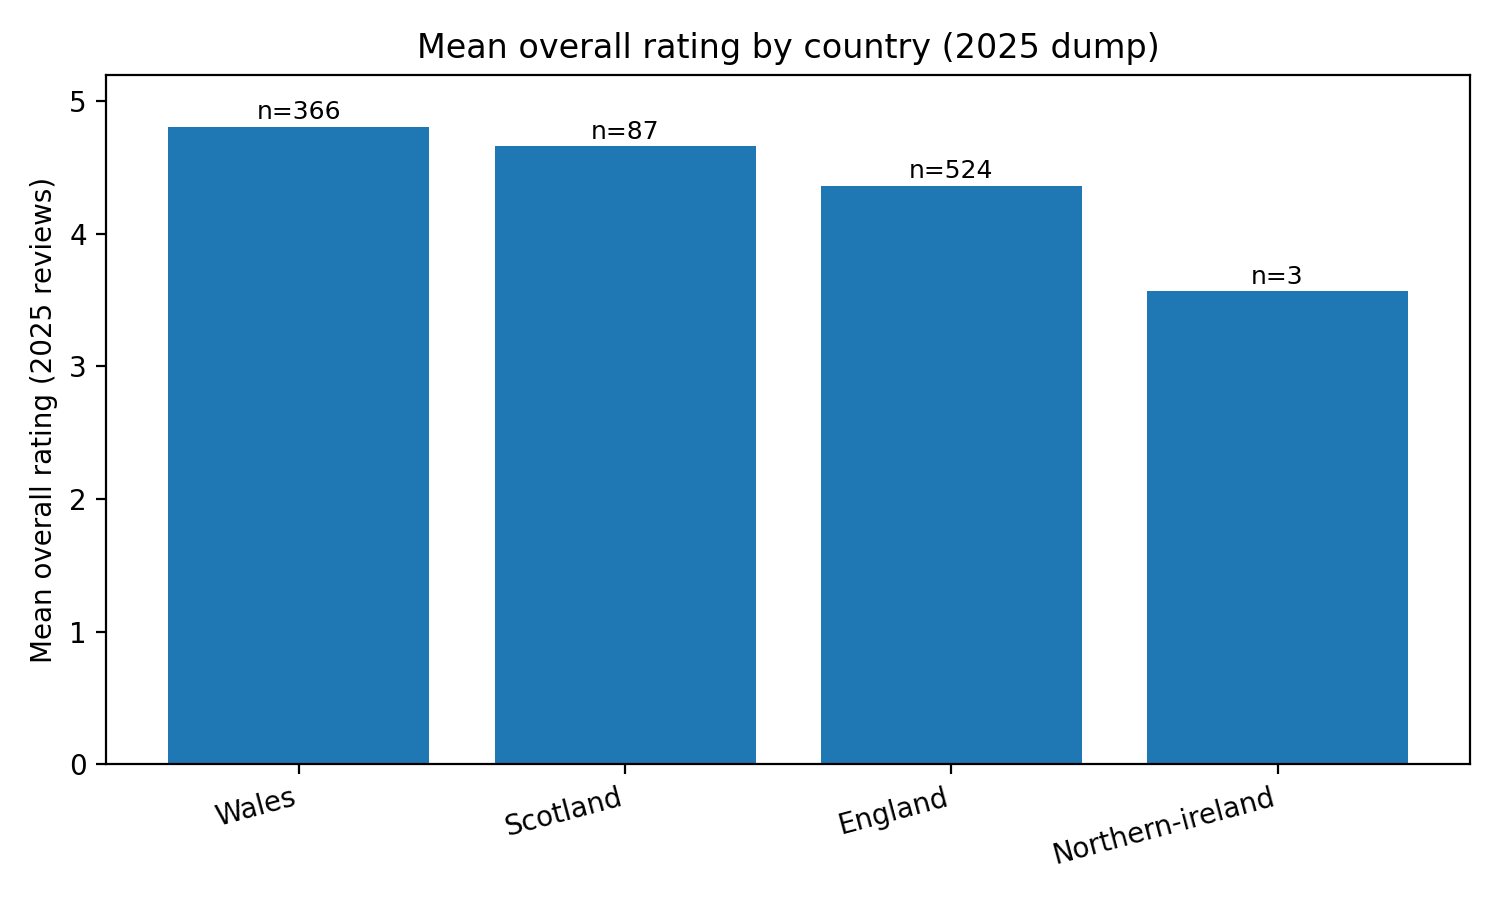
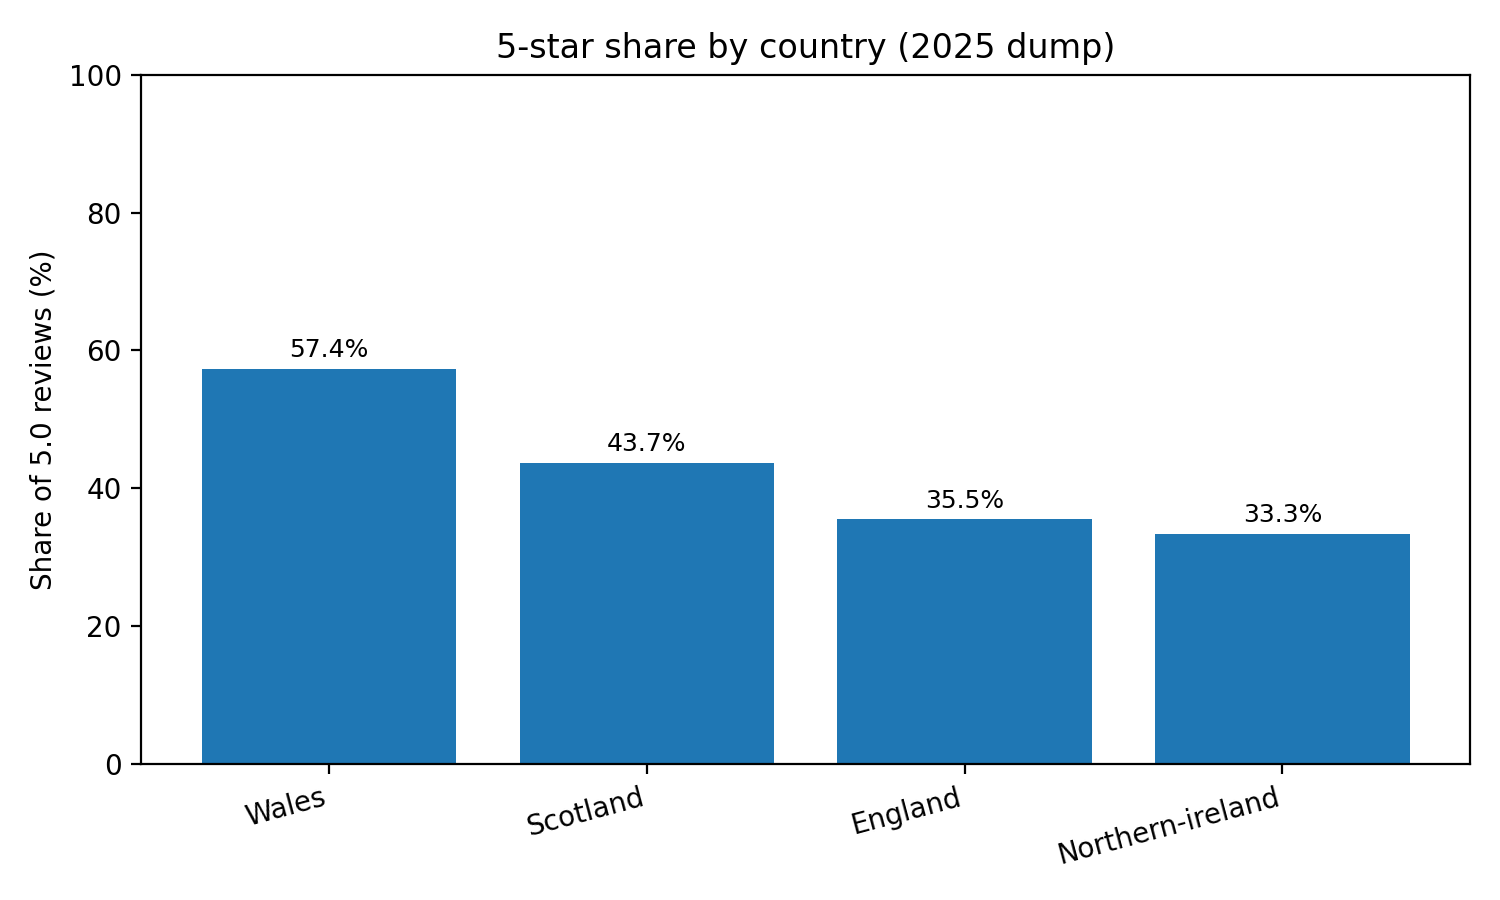
What the charts show: Wales has the highest mean rating and the highest share of 5-star reviews in this 2025 export. Scotland sits between Wales and England on both measures. Northern Ireland has only a small number of reviews in the export, so it should not be used for comparison.
Context for interpreting the pattern: England is likely to look more variable in a review export like this because it typically covers a wider spread of venues and trail models, which can widen the range of experiences riders are reviewing. This is context rather than a definitive claim drawn from the country charts alone.
Northern Ireland note: Even though Northern Ireland is a small-sample signal in this 2025 export, iBikeRide coverage this year includes substantial rider feedback describing official trail centres as being in poor condition or long-term decline, alongside storm damage and extended closures, and a volunteer maintenance scheme now underway. The country charts should not be used to “rank” Northern Ireland, but this wider context helps explain why Northern Ireland is treated carefully in the comparative analysis
What the trail type dimension chart tells us
This chart shows the average dimension scores by trail type, using only venues that were classified and have 5 or more reviews in the 2025 export. It is a useful way to see how rider scoring patterns differ between venue models, but it should be read as a directional snapshot rather than a verdict on any single venue.
How to read it: each group (Grin, Variety, Skills, Quality, General Setup (parking, access, signage, on-site basics, facilities) shows the mean score for each trail type. Higher bars mean riders rated that dimension more strongly, on average, for that venue model.
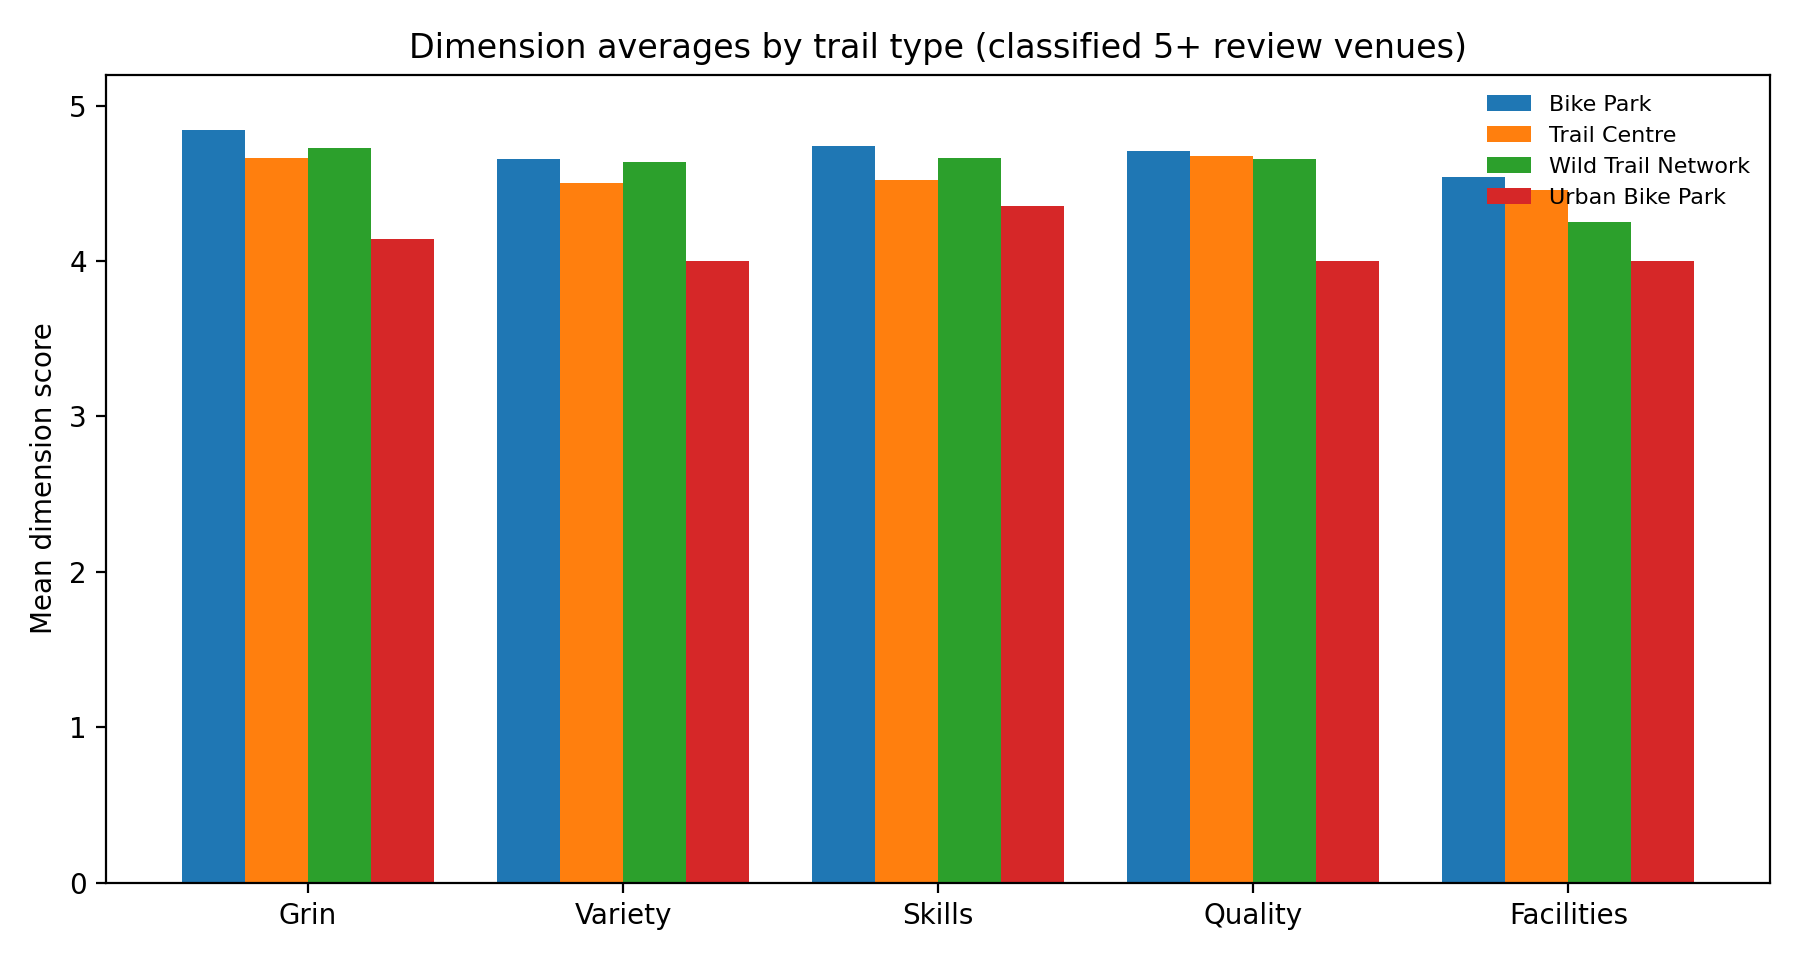
What it suggests in 2025:
- Bike parks have the strongest average scores across all five dimensions in this dataset. The biggest separation is in Grin and Skills, which aligns with a rider focus on features, progression, and session value.
- Trail centres score strongly overall, and sit close to bike parks on Quality. In this export, trail centres average slightly lower than bike parks on Skills and General Setup.
- Wild trail networks are close to trail centres on Grin, Variety, and Skills, but sit lower on General Setup. That fits the trade-off riders often accept in less formal networks (for example fewer facilities and less structured arrival information).
- Urban bike parks score lowest on average across the dimensions here, with the clearest gaps in Grin, Variety, and General Setup. This is a useful flag for where rider expectations may be less consistently met, not a judgement on any single site.
Why this matters: this is one of the clearest ways to see how the same riders score different venue models. Operators and land managers can use it to benchmark which dimensions tend to matter most for their category, then cross-check the qualitative themes and quotes in the main report.
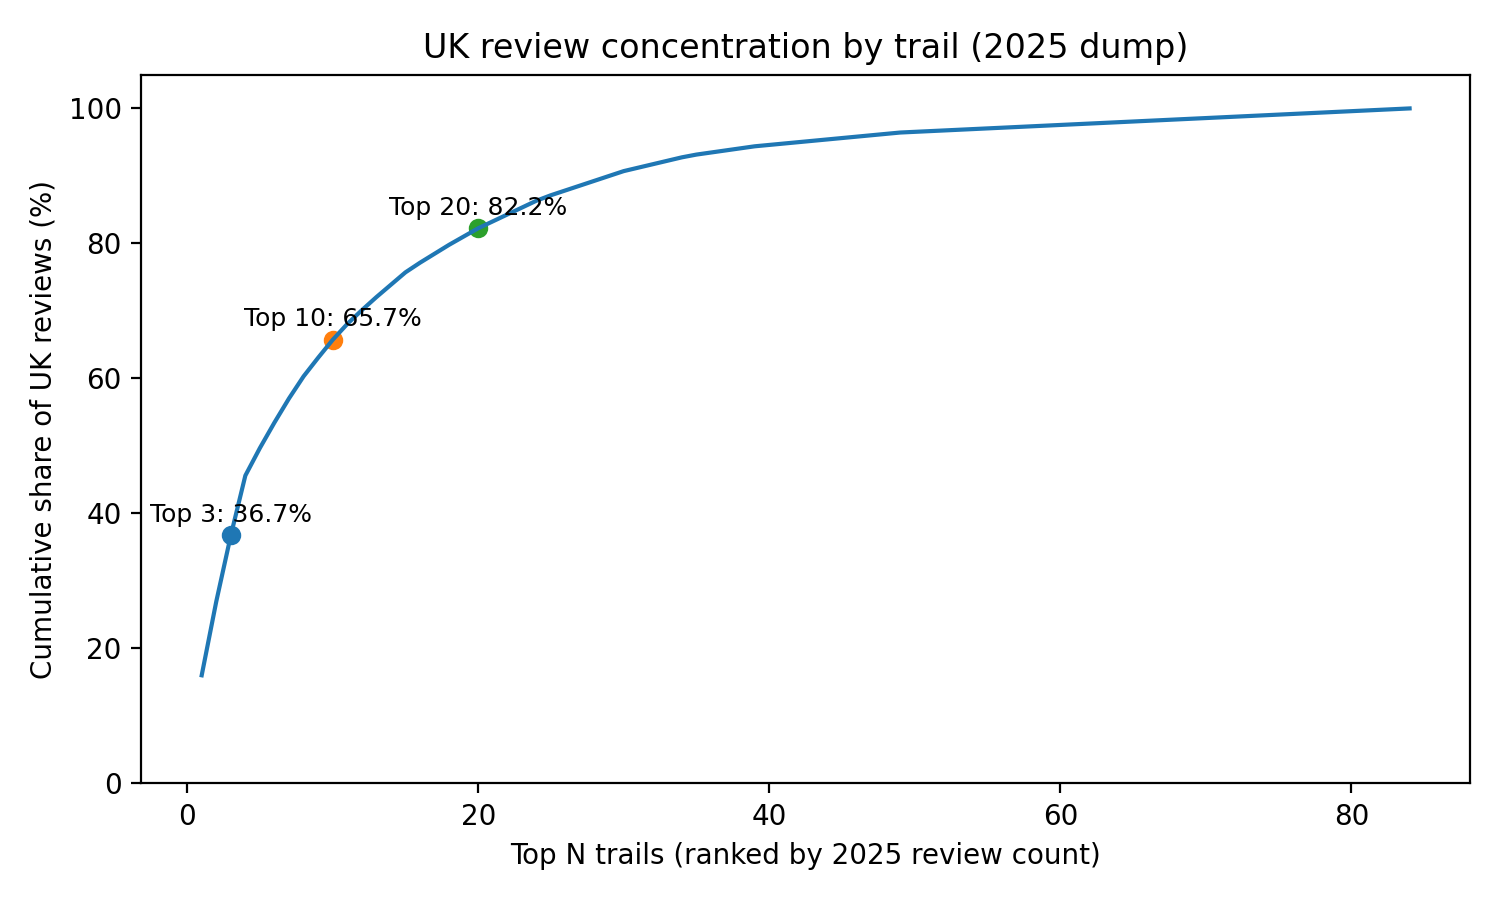
Dataset context: review concentration
This chart shows how review volume is distributed across venues in the 2025 export. A small number of trails account for a large share of reviews, followed by a long tail of venues with fewer reviews.
Why this matters: high-volume venues shape national averages more than low-volume venues. Single venues with small numbers of reviews can still provide useful local insight, but they are weaker as “national signals”. Where the report makes comparisons (for example, by trail type), it uses thresholds such as 5+ reviews to reduce noise.
Appendix
Trail of the Year top ten (reference list)
This list is included for context. It is separate from the analysis and the trail type sections above.
- Hafod Trails
- BikePark Wales (Gethin Woods)
- Glenlivet Mountain Bike Trail Centre
- Forest of Dean Mountain Bike Trails
- Cwmcarn Mountain Bike Centre (Risca)
- Dyfi Bike Park
- Phoenix Bike Park
- Twisted Oaks Bike Park
- Hamsterley Forest Mountain Bike Trails
- Longleat Forest (Wind Hill)
How this report uses the dataset
This report summarises what riders wrote in iBikeRide reviews during the 2025 Trail of the Year campaign period. It is a snapshot of rider feedback, not an audit of any venue. Review volume is concentrated in a smaller number of venues, so country and trail-type comparisons should be read as indicative signals, not definitive rankings. Some reviews were removed for rule-breaking and are not included in this analysis. It combines simple quantitative summaries (counts, averages, and charted comparisons) with qualitative evidence taken from review text.
Dataset scope
- Reviews analysed: 984
- Unique trails: 92
- Date range: 2025-02-05 to 2025-08-21
How we summarise the national picture
- Review concentration: we show how review volume is distributed across trails (a small number of trails account for a large share of reviews). This provides context for how strongly high-volume venues can shape national averages.
- Theme mentions in review text: we use keyword-based theme detection to count how often riders mention topics such as variety, progression, maintenance, community, and General Setup. These counts are directional indicators of what riders talk about most, not a judgment on whether each mention is positive or negative.
- Country comparisons: we show mean rating and the share of 5.0 reviews by country. These are high-level signals and should be interpreted alongside differences in review volume and venue mix.
Top, middle, and bottom slices
In a few places we compare “slices” of the dataset. This is used to show how rider language and priorities shift across the rating spread.
- Top slice: a small group of the highest mean-rated venues in the 2025 export.
- Middle slice: venues around the middle of the rating distribution (near the median), included to avoid the analysis becoming only “winners vs worst”.
- Bottom slice: a small group of the lowest mean-rated venues in the 2025 export (with specific exclusions where a location is not comparable as a single venue).
Trail type comparisons
For trail type charts, we only include venues that are classified and have 5 or more reviews in the 2025 export. This reduces noise from very small samples. The “General Setup” dimension covers parking, access, signage, facilities, and the overall on-site experience.
Why we use keyword-based themes
The theme charts use keyword-based matching because it is a transparent way to describe what riders chose to talk about. It lets readers understand and challenge the method, and it avoids implying a level of precision that is not realistic for short, informal review text.
We did not use automated sentiment scoring to label themes as “positive” or “negative” because the same topic can be praised or criticised depending on context (for example, maintenance, facilities, or progression). Where the report discusses improvements, it does so by combining theme frequency with the plain meaning of rider quotes and examples, rather than a black-box sentiment score.
How quotes are used
Quotes in this report are individual rider reviews and are used to illustrate themes that also appear in the quantitative summaries. As a default, negative quotes in the main report are not attributed to named trails to avoid implying a single comment represents a venue. Exceptions are clearly signposted case studies where the point is supported by repeated feedback in the 2025 export, or where iBikeRide has already published a dedicated context article with the trail's agreement.
Copyright and reuse
© iBikeRide.com 2025. You are welcome to share the report by linking to it. You may quote short excerpts with attribution and a link back to the original page. For reproducing charts, tables, or longer excerpts, please request permission: https://ibikeride.com/contact
Read: 276 times Published: 21/12/2025